Facebook Insights had always been a handy tool for page owners irrespective of the size they command. It always provided information about how to make the page even better. Last month Facebook launched a new version of Facebook Insight. Many had speculated it to be a paid service, but so far Facebook is not charging anyone. Here is a look at how the insights have evolved.
Section 1: Reach Measurement
1.1 Friends of Fans
Facebook advertising provides the option to target friends of fans. Essentially this means that the ad will only be shown to friends of people already on the brand page. Now through Page Insights, one can see the total reach of ‘friends of fans’. This is an important number to keep an eye on, as it will ensure that when someone engages with a piece of content on the Page, their friends are being alerted to it. It gives a more accurate reflection of your ‘ambient’ audience. i.e. those who might not be fans of your Page themselves (as this number excludes current fans) but who may have been exposed to your message :
1.2 People Talking About This
This is the most hyped feature that Facebook has introduced. It gives a figure, for the time period that one selects, of the number of times a post was generated about the Page, including links in personal profiles, or posts in which the Page has been tagged in.
Within this new metric, one can see a demographic breakdown of people who are talking about the Page by age, gender and location. One can also compare the viral reach (the number of people who saw your Page), compared to ‘talking about this’ (the number of people who actively created a story). As reach just takes into account people that were exposed to your content, this figure will always be a lot higher than those people talking about it. Individual ‘story’ can be compared, for example the number of times someone tagged the page in a post or photo:
1.3 Weekly Total Reach
Earlier for a post on Facebook Page one could see the individual number of impressions, but not the cumulative total. Now Facebook has introduced a feature that gives the weekly total reach, which is the number of times someone has been exposed to the Page, either through a post, a friend commenting, or through an ad. One can see the percentage change over time, thus, if there is increase in fans but the reach is going down, brand may need to think about creating more engaging content, so as to grow organically:
Section 2: Post Insights
2.1 How viral is a post?
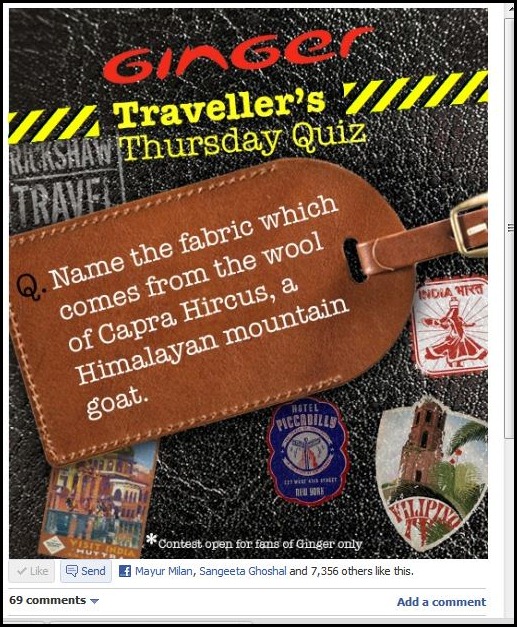
Facebook ranks the posts in order of engagement, as before, but this has been massively expanded on. Now, ranks also show a number of different metrics, which cover : Reach (the total number of people that saw your post) ; Engaged Users (people who interacted with the post in some way, such as clicking on the post in their newsfeed or leaving a comment) ; Talking About This (the number of people who have created a ‘story’ from your post, such as leaving a reply or sharing with friends) and Virality which is slightly more complex. The ‘virality’ of a post is expressed as a percentage of people that created a story about the post, against the total reach. Seeing the posts in this way allows brands to see the content that clearly worked, or didn’t work:
2.1.1
One can then expand on a particular figure, to get more detailed insights. Clicking on ‘reach’ reveals a breakdown of whether that reach came directly from your Page activity, Facebook Ads, or whether it was viral (fans generating stories)
2.1.2
Clicking on ‘engaged users’ shows: Other clicks (clicks on other parts of the post, such as the name of the person that posted it) ; Link clicks (the number of clicks in a link on your post) ; the number of stories generated from the post, by fans :
2.1.3
Clicking on ‘talking about this’ allows people to see whether these stories generated were someone who likes the post or sharing it:

![clip_image002[6]_thumb[2]](https://windchimes.co.in/blog/wp-content/uploads/2011/11/clip_image0026_thumb2_thumb.gif)
![clip_image004[6]_thumb[2]](https://windchimes.co.in/blog/wp-content/uploads/2011/11/clip_image0046_thumb2_thumb.gif)
![clip_image006[6]_thumb[2]](https://windchimes.co.in/blog/wp-content/uploads/2011/11/clip_image0066_thumb2_thumb.gif)
![clip_image008_thumb[2]](https://windchimes.co.in/blog/wp-content/uploads/2011/11/clip_image008_thumb2_thumb.gif)
![clip_image010_thumb[2]](https://windchimes.co.in/blog/wp-content/uploads/2011/11/clip_image010_thumb2_thumb.gif)
![clip_image012_thumb[2]](https://windchimes.co.in/blog/wp-content/uploads/2011/11/clip_image012_thumb2_thumb.gif)
![clip_image014_thumb[2]](https://windchimes.co.in/blog/wp-content/uploads/2011/11/clip_image014_thumb2_thumb.gif)
![clip_image016_thumb[2]](https://windchimes.co.in/blog/wp-content/uploads/2011/11/clip_image016_thumb2_thumb.gif)


